
Welcome to the ultimate face-off between Trump and Biden. We’re about to dive into a no-nonsense comparison of their presidencies, peeling back the layers on how each handled everything from the economy and jobs to crime and energy. Who really did a better job? Buckle up as we cut through the fluff and get straight to the heart of their legacies. Let the showdown begin!
*note: This is a difficult comparison due to Covid, but we will try to be as fair as possible considering those factors.
Economy
People Experiencing Homelessness by Sheltered Status
The number of people experiencing homelessness


This first metric shows a pretty stable line up until 2022 where it shoots way up. This is most likely due to covid but considering the severity, we had to give this one to Trump. The number of people experiencing homelessness increased in 2023 to 653,104, and has been trending upward. About 39%, or 256,610 homeless people, stayed in unsheltered locations in January 2023.
Consumer Price Index — Inflation
Year-over-year inflation — the rate at which consumer prices increase

When it comes to consumer prices there is a clear winner as there was a huge spike during Bidens term which luckily is on the decline. This spike likely a result of Covid, but we base our decision on the high inflation even after Covid had declined dramatically. In this scenario Trump is the clear winner.
Federal Funds Rate – Interest Rates
Rate increases make it more expensive for banks to borrow from each other. Banks pass these costs on to consumers through higher interest rates.

Interest rates definitely saw a rise during Trumps term, but during the end of Bidens term the rate nearly doubled and remained high, even after Covid cases had declined. We have to give this one to Trump.
Ratio of Unemployed Persons to Job Openings
The Ratio of Unemployed Persons to Job Openings represents how many unemployed individuals are competing for each available job, indicating the balance between job supply and demand in the labor market.


This one’s tough. There was a clear decrease during Trumps term but then a huge spike just before Biden took office. However that spike quickly fell into a record low. Considering the drastic increase in the ratio of unemployed persons to job openings in 2020 was a direct result of the pandemic’s severe impact on the economy, leading to a surge in job losses and a significant drop in job availability, as well as the record low rates that followed, we are going to call this one for Biden.
Unemployment Rate, by Race and EthnicityThe unemployment rate was 3.8% at the beginning of 2016 and 3.7% by the end. With a huge spike between.


Another close one. Too close to call. The biggest difference being a direct result of Covid, We will call this a tie.
Labor Force Participation Rate
The Labor Force Participation Rate measures the percentage of the working-age population that is either employed or actively seeking employment.

Trumps term starts at 62.7% and the rate climbs to 63.3% in 2020, then crashes due to Covid, and then sees some normalcy return just before Biden takes over. Considering the affects of covid and while Biden seemed to try really hard to get these numbers back up, we are going to edge this one to Trump but just barely.
Immigration
Total New Immigrant Entries
Authorized immigration to the US
Believe it or not, Under Trump the US saw some really high numbers when it comes to legal immigration. And then there was Covid. That being said Biden quickly recovered, returning the numbers back to pre pandemic levels and even surpassing Trump. This one goes to Biden.
Border Enforcement Actions
The number of immigrants turned away or apprehended at US borders

I was surprised by this data. Obviously Covid plays a huge part in the spike you see which is peaking in 2022 with just under 3 million apprehended or turned away. That number reached 3.2 million in FY 2023, the most since at least 1980.
More than 2 million immigrants were apprehended illegally entering the US. The remaining 1.1 million were turned away at legal ports of entry by of the Office of Field Operations — more than double the number in FY 2022. While this may be due to an increase in immigrants attempting to come here illegally, we have to give this one to Biden as he clearly apprehended more than Trump did during his term. Yes it surprises me to.
Noncitizen Removals
Removals are based on an order of removal, and have administrative or criminal consequences placed on subsequent reentry.
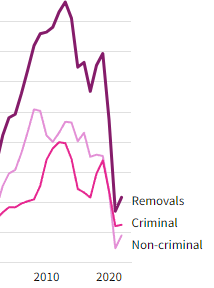
Now that’s the Trump we know. That valley just before the peak on the far right side, is 2016 and 2017. The peak is 2019. In 2020 there was a huge drop because the border was shut down due to Covid, no one was coming or going. That peak of total removals represents nearly 350,000. Comparing this to Bidens term, Immigration officials removed nearly 109,000 people from the US in FY 2022, the most recent year where data is available. This is the fewest removals since 1996, except for 2021. This one is going back to Trump.
Crime
Crime Rates Per 100,000 People
This data counts incidents where multiple offenses were committed under just the most serious offense.

When it comes to crime rates under Trumps term, both property crime and violent crime saw a steady decline. With a slight uptick in violent crime in 2020. Under Biden however, In 2022, the violent crime rate fell for the second consecutive year, down to 380.7 per 100,000 people. The property crime rate increased for the first time since 2001, up 6.7% to 1,954.4 per 100,000 people. This seems to be pretty clear that Trump was better on crime.
Property Crime Rates Per 100,000 People
This data measures measure the frequency of property-related crimes, like burglary and theft, occurring among every 100,000 individuals in a given population, providing a standardized way to compare crime levels across different areas.

Property crime rates under Trumps term saw a steady decline. Under Biden however, For the first time in two decades, larceny-theft crime rates increased (up 7.4%) in 2022. The crime rate for motor vehicle theft increased the most (10.5%) compared to other property crimes, while burglary decreased for the 11th consecutive year. Similar to the previous metric, Trump is tough on crime.
Education
Math and reading proficiency
Percent of 8th graders at or above proficient

Lets be honest. There is no winner here. When Trump took office Reading proficiency was at its highest since at least 1990. It’s all down hill from there. The National Center for Education Statistics (NCES) reported that the average math scores for 9-year-olds dropped for the first time ever, with a decline of seven points, while reading scores fell by five points between 2020 and 2022. This decline represents the largest drop in reading scores since 1990. Many attribute this to Covid stating that the abrupt transition to remote learning disrupted traditional education. While proficiency was higher during Trumps term, it was steadily falling. We’re calling this a tie.
Energy
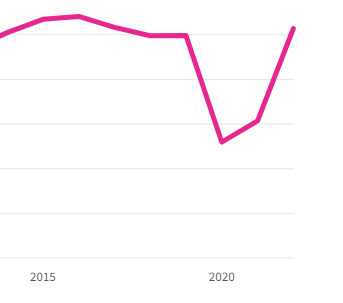
Average Retail Fuel Prices Per Gallon
Regular gasoline and diesel fuel, adjusted for inflation (2023 dollars)

Under Trump fuel cost fell to levels we hadn’t seen since 2002. And then quickly rose under Biden. Average prices for a gallon of regular-grade gas fluctuated between $3.29 and $3.81 in 2023 after reaching nearly $6 in June 2022. However, 2023’s peak average monthly price —$3.81 in August —was higher than any month between November 2014 and February 2022. We’re giving this one to Trump.
Fossil Fuel Energy Production
Coal was the most common fossil fuel produced in the United States from the late 1980s until April 2011*; since then, average monthly coal production has dropped 47%.

This one is hard to judge because it depends on whether or not you think fossil fuel production is good or bad. So we are going to call it a tie. Under Trump coal production went down, under Biden it went up slightly. All other fossil fuels had a pretty steady increase with the exception of 2020, which appears to be a result of Covid.
Renewable and Nuclear Energy Production
A 12-month rolling average is the average for the stated calendar month value and each of the previous 11 calendar month values divided by 12.

We are going to edge this one just ever so slightly towards Biden. The reason being, during his term there was a significant increase in wind and solar production, though Nuclear did take a small dip. With everything else pretty steady and the exception of a 2020 dip due to covid I feal Biden just barely pulls ahead here.
Federal Budget
Federal Debt
Adjusted for inflation (FY 2023 dollars)

This is another tough one. With Covid there was a lot of additional spending which lead to steady debt increase. The national debt hit nearly $33.2 trillion at the end of fiscal year 2023. The federal debt held by the public (total debt excluding intragovernmental debt) is equivalent to 95.4% of GDP. This is slightly higher than in FY 2022 when it was 93.6%, and higher than the average of 71.0% over the 10 years before the pandemic. We are going to call it a tie!
Trump clinches the win overall, and it’s a decisive one. His victories in economic stability, crime reduction, and energy costs give him the edge. However, it’s worth noting Biden’s strong performance in navigating the post-COVID landscape, with significant strides in energy production and immigration. While Trump leads in many areas, Biden’s efforts in managing the impact of COVID-19 and addressing critical issues like energy and border enforcement also deserve recognition. This comparison highlights Trump’s standout results while acknowledging Biden’s notable achievements in challenging times.
Data source: https://usafacts.org/